About DependencyGraph · Release notes · Visual Studio Marketplace
A Visual Studio extension that draws your solution’s project-to-project reference graph in a dockable tool window — laid out properly, not just dumped to a file.
Useful when you are working out what a project actually drags in, why a build takes so long, whether a reference can be removed, or where a circular reference crept in.
Contents
- What you see
- Installing
- Requirements
- Opening it
- The command bar
- Views
- Getting around
- Highlighting
- Circular references
- Exporting
- Options
- Grouping by solution folder
- Moving things about
- Target frameworks
- External references
- When the solution changes
- Themes
- Known limitations
What you see
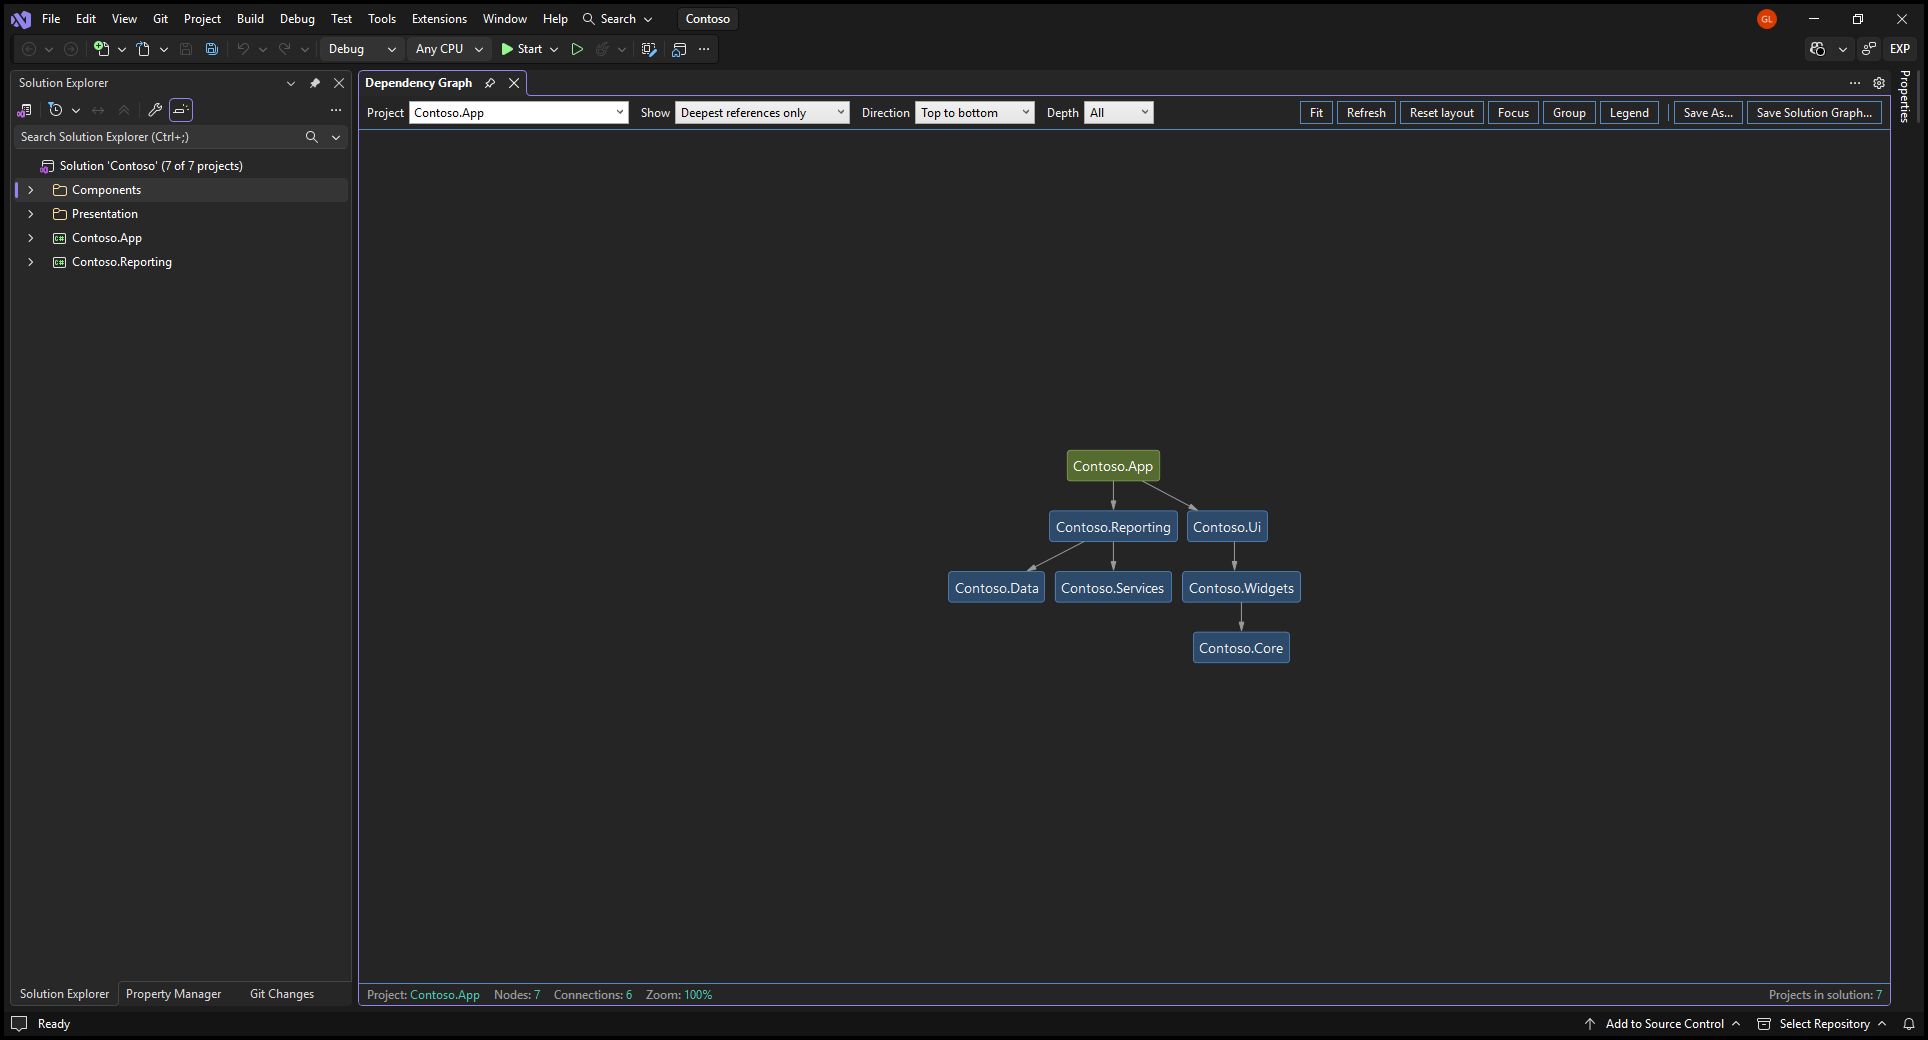
One box per project, one arrow per reference, pointing from the project that has the reference to the project it depends on.
Contoso.App ──────────► Contoso.Services ──────────► Contoso.Core
└────┬────┘             └───────┬───────┘            └─────┬────┘
   root                    depends on                  depended on
 (olive green)
The project you are looking at is the root, filled olive green. Everything else is blue. In the Entire solution view there is no root, so olive marks the projects nothing else references — the solution’s entry points.
The graph opens at 100% zoom so the labels are crisp — use Fit when you want the whole thing in view instead.
The status bar carries the numbers: which project is rooted, how many nodes and connections are drawn, the current zoom, the selected project with its reference counts, and how many projects the solution has in total.
Installing
From the Visual Studio Marketplace, or from Extensions → Manage Extensions inside Visual Studio — search for DependencyGraph.
Nothing to configure afterwards. In particular, you do not need Graphviz and you do not need the DGML editor — the graph is drawn inside the IDE. Graphviz is only used if you choose the SVG or PNG options under Exporting.
Requirements
| Visual Studio | 2022 (17.x) or 2026 (18.x), amd64 |
| .NET Framework | 4.8 |
| Graphviz | Optional — only for the Graphviz SVG/PNG exports |
Project references are read through VSProject.References, which is a C#/VB/F# facility. C++,
database, shared and unloaded projects appear in the solution count but have no references the
extension can read, so they show up as isolated nodes rather than errors.
Opening it
Either:
- Tools → Show Dependency Graph
- right-click a project in Solution Explorer → Show Dependency Graph
The window docks in the document area, and Visual Studio remembers where you put it. It is a tool window, not a dialog, so the rest of the IDE stays usable while it is open — click around Solution Explorer and press Refresh to rescan.
The command bar
| Control | Meaning |
|---|---|
| Project | Which project to root the graph at. Type to search. Greyed out under Entire solution, which has no root. |
| Show | Which references become arrows — see Views. |
| Direction | Top to bottom, Left to right, Bottom to top or Right to left. |
| Depth | All, or 1–6 levels. Limit this on a large solution. |
| Fit | Zoom so the whole graph fits the window. |
| Refresh | Re-read the solution: its projects and what each one references. About the data, not the picture — anything you dragged stays put. |
| Reset layout | Discard the nodes you have dragged and lay the graph out again. About the picture, not the data. |
| Focus | Draw only the selected projects and the references between them. Ctrl+click nodes to select several. |
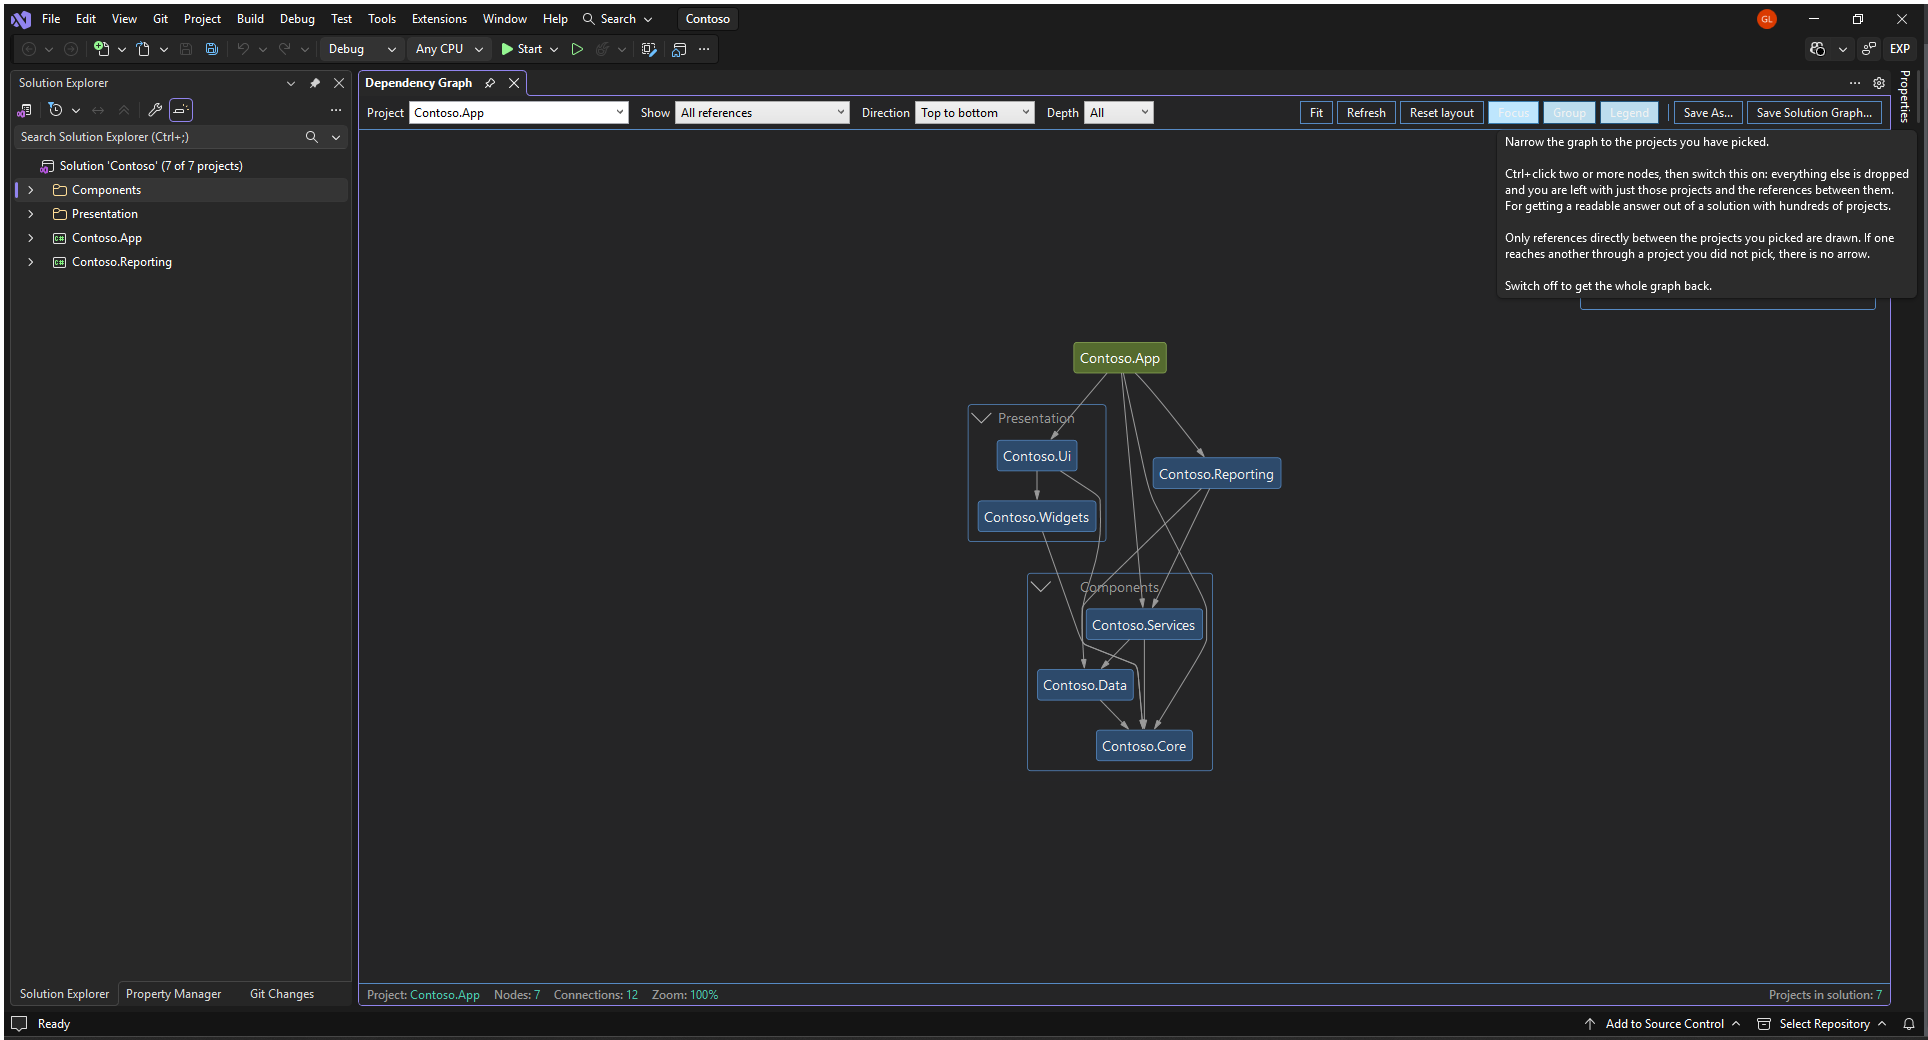
| Group | Draw a box around each solution folder, named after it. Click the chevron on a box to fold that folder down to one shape. |
| Legend | Show what the colours mean. |
| Save As… | Export this project’s graph — see Exporting. |
| Save Solution Graph… | Export every project in the solution, not just this one. |
Every control has a tooltip saying what it is for — and, where it matters, what it will not do:
Views
The Show dropdown changes which references are drawn, not which projects:
| View | What it draws |
|---|---|
| Deepest references only | One arrow per project, from the deepest project that references it. Gives a clean tree — the quickest way to read the shape of a dependency chain. |
| All references | Every reference of every project. The honest picture, and busier: a project referenced by four others gets four arrows. |
| Project references only | Just the selected project and the things it references directly. Two levels, nothing transitive. |
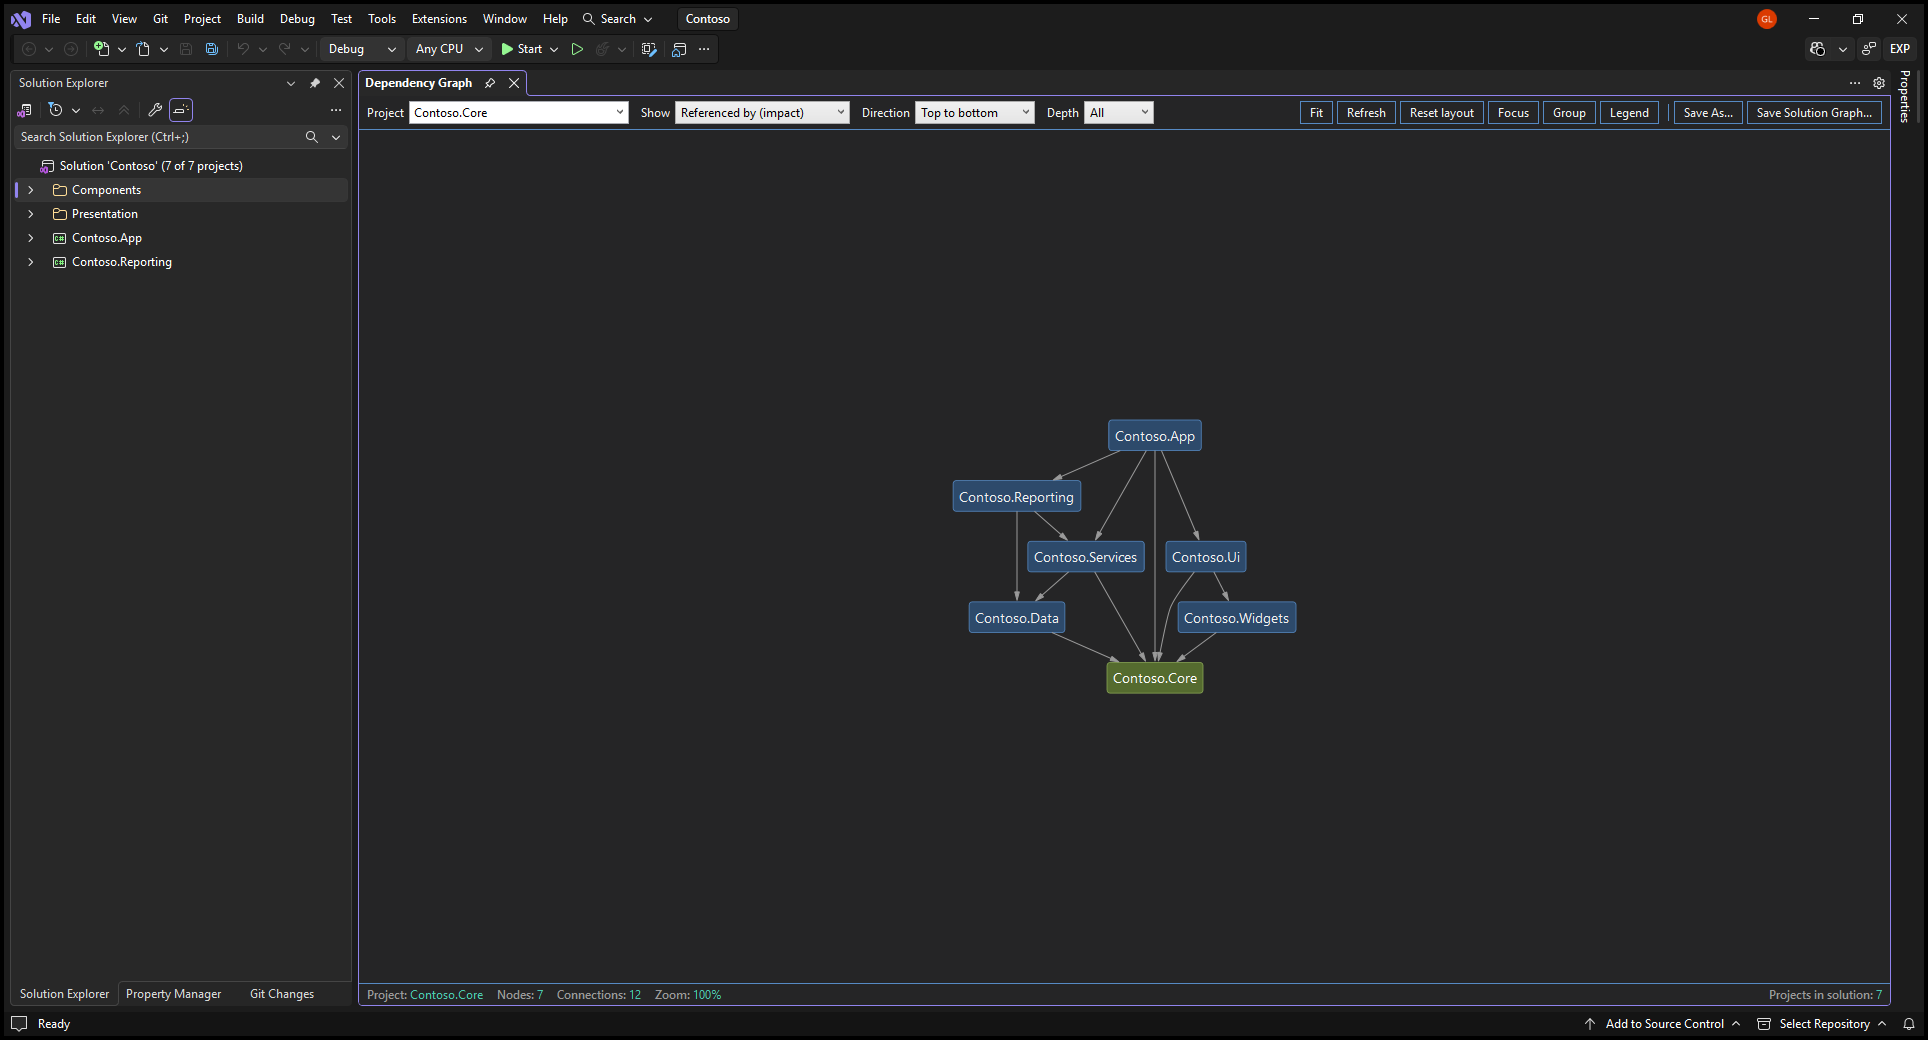
| Referenced by (impact) | Turned around: every project that depends on this one, directly or transitively. What breaks if you change it. Arrows still point at the dependency, so the project you asked about sits at the bottom. |
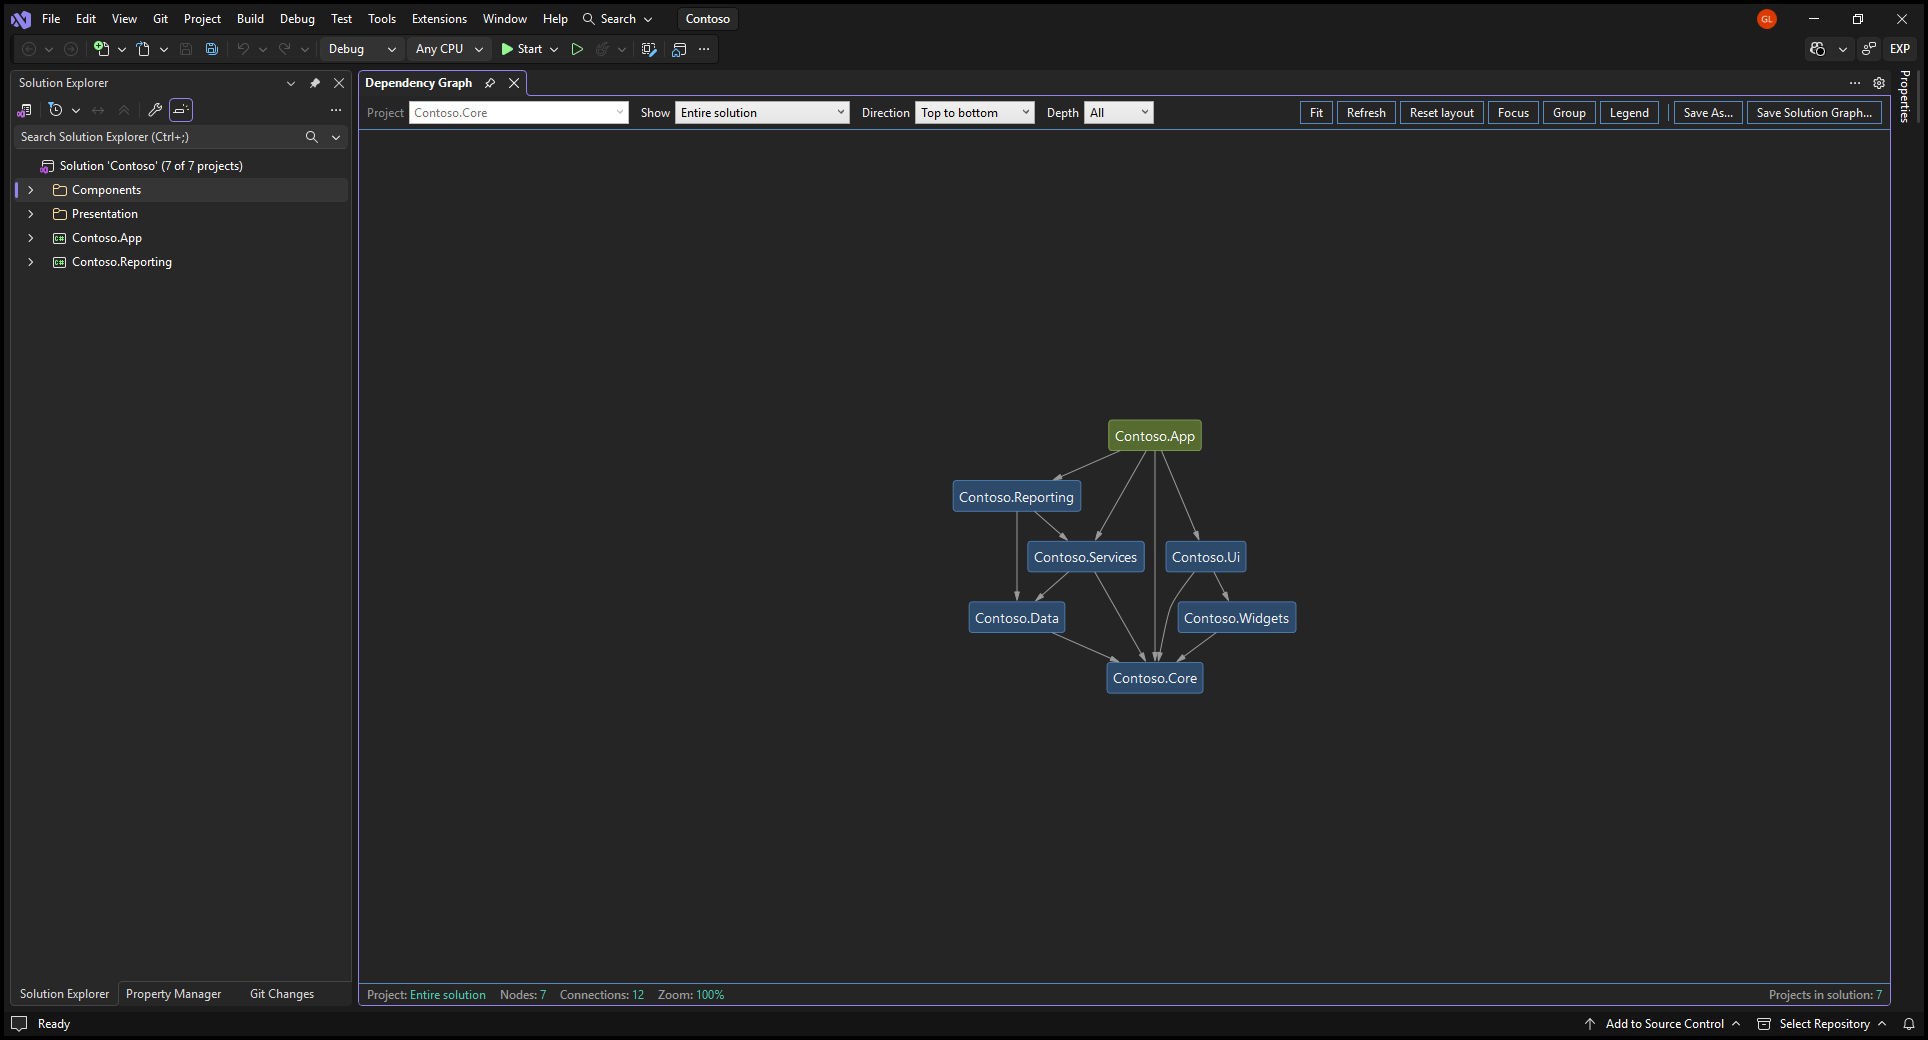
| Entire solution | Every project in the solution and every reference between them, with no root. The other four start at one project and can only reach what that project reaches; this is the one that shows a solution with several entry points whole. |
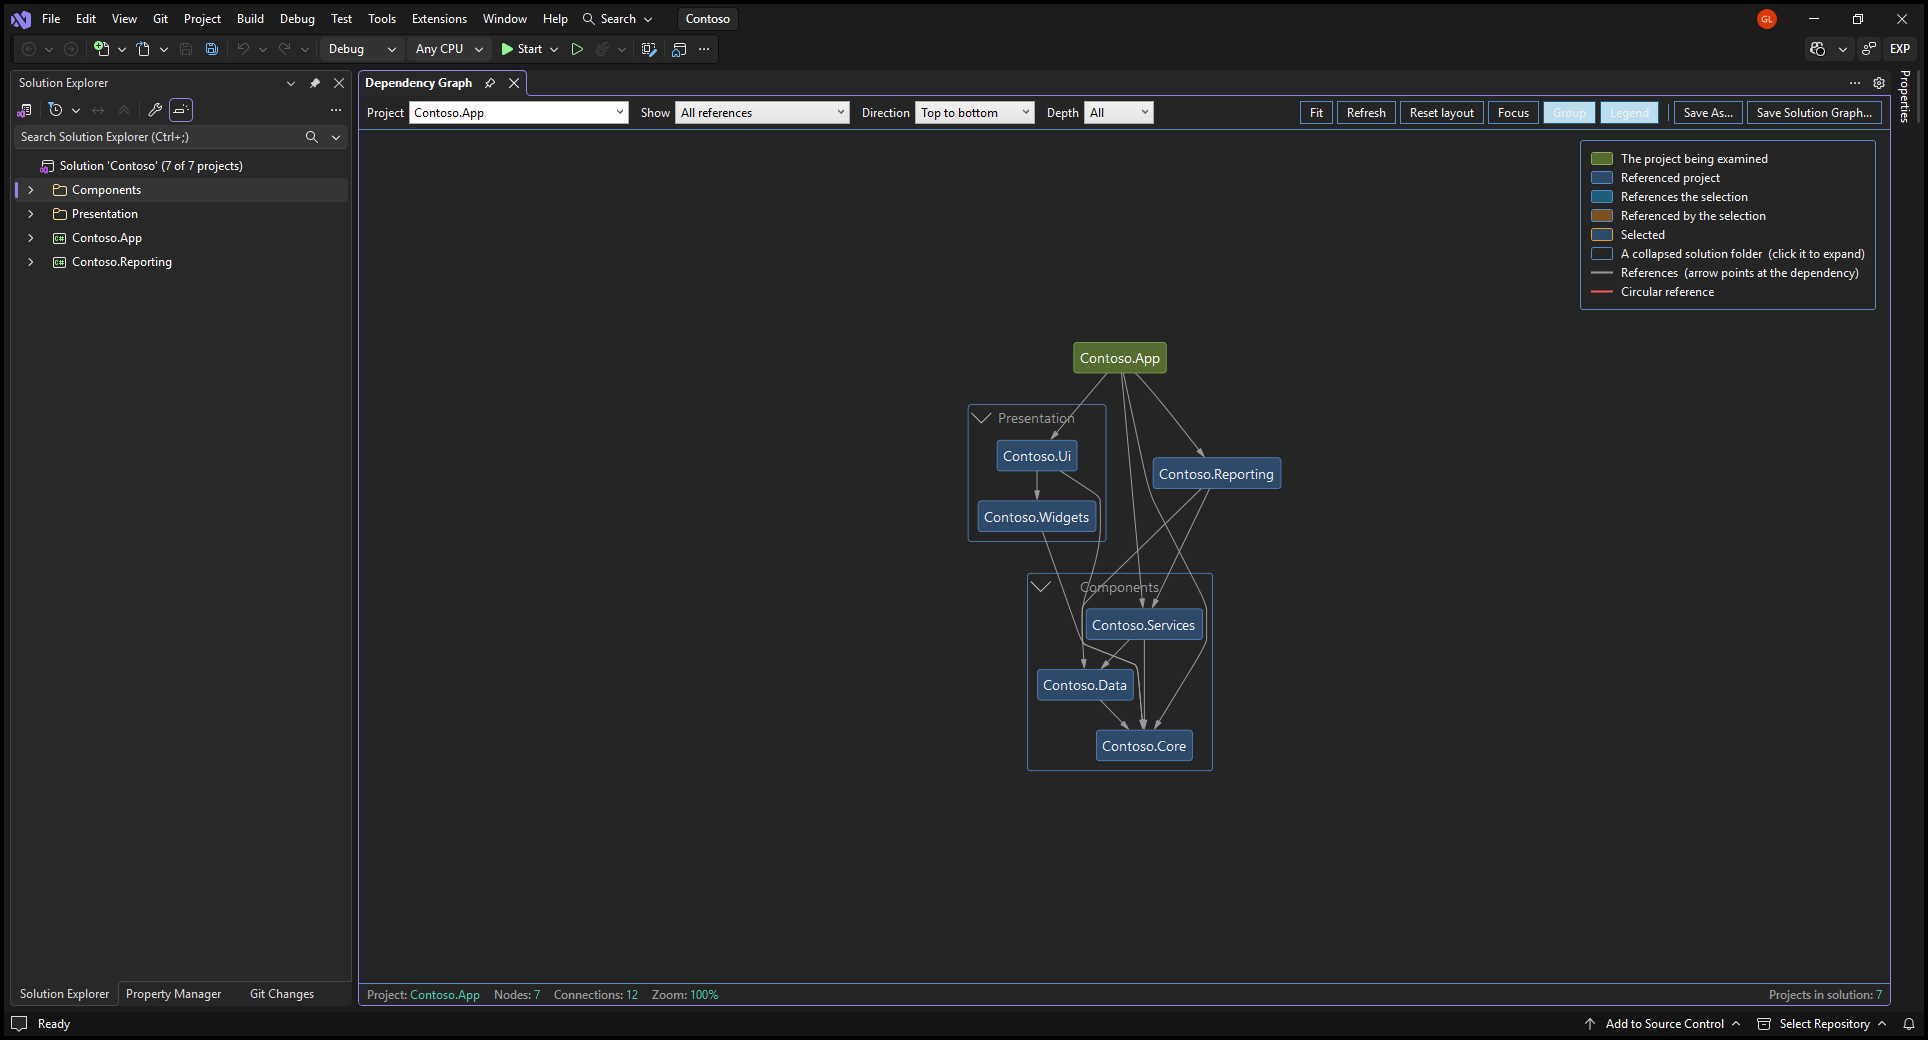
On the sample solution above, the same seven projects give 6 connections under Deepest and 12 under All.
Everything that depends on one project, which no other view shows:
The whole solution at once, with the one project nothing else references drawn as a root:
Depth is the other lever. All follows the references as far as they go; a number stops
after that many levels. Whole levels are cut cleanly — you never get an arrow pointing at a
project that was left out.
Getting around
| Action | Result |
|---|---|
| Drag the background | Pan |
| Drag a node | Move it. Its references follow it, and nothing else shifts. |
| Drag a folder box | Move the whole group - the box, the projects in it and their references. |
| Reset layout | Put everything back where the layout wants it. Also on the background right-click. |
| Mouse wheel | Zoom |
| Fit | Fit the graph to the window |
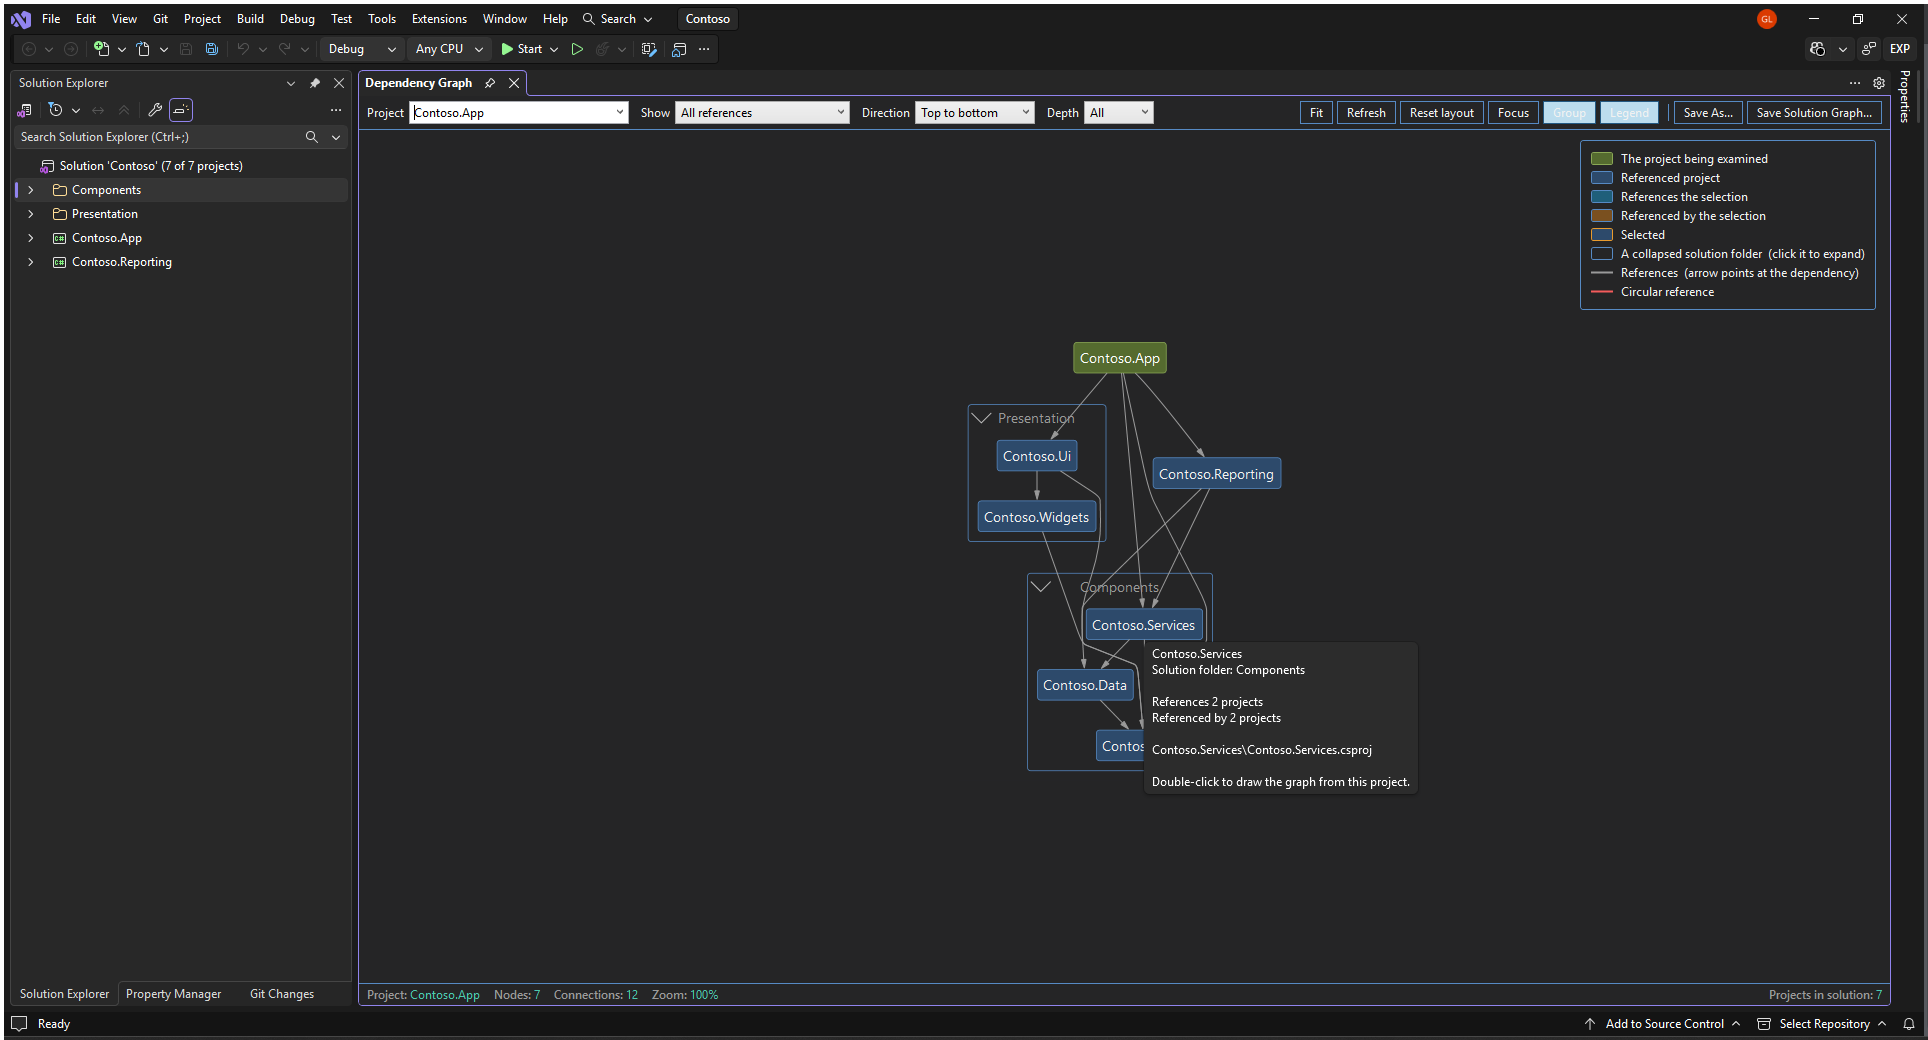
| Hover a node | A tooltip with its target framework, solution folder, reference counts and path |
| Click a node | Select it; the status bar shows its reference counts and project path |
| Double-click a node | Re-root the graph on that project |
| Right-click a node | Highlighting menu — see below |
| Ctrl+click a node | Add it to the selection, for Focus |
| Ctrl+S | Save the graph as a PNG |
Hovering a node says the rest - a box only has room for a short name:
Highlighting
Right-click any node:
- Highlight projects referencing … — everything that depends on this project. What breaks if you change it.
- Highlight projects referenced by … — what this project depends on directly.
- Show the reference graph of … — re-root on that project, same as double-clicking.
- Clear highlighting — back to the resting colours.
Circular references
A reference that closes a cycle is drawn in red and labelled cycle.
Visual Studio will not let you create a circular project reference through the UI, but a
hand-edited .csproj can still produce one and the solution will load — it only fails at build
time, with an error that does not name the projects involved. This points straight at them.
Exporting
Save As… exports the graph currently on screen:
| Format | Notes |
|---|---|
| PNG | The whole graph, cropped to it — not just the part scrolled into view. |
| DGML | Opens in Visual Studio’s own directed-graph editor, if you have that component installed. |
| Graphviz DOT | Plain text, for dot or any other Graphviz tool. |
| Graphviz SVG / PNG | Rendered by dot. Only offered when dot.exe is on your PATH. |
Save Solution Graph… does the same for every project in the solution at once, in DGML, DOT, SVG or PNG.
Nodes are identified by the project’s solution-relative path rather than its name, so two projects sharing a name in different solution folders stay separate in the exports.
Options
Tools → Options → DependencyGraph → General:
| Setting | Default | Meaning |
|---|---|---|
| View | Deepest references only | Which view the window opens with. |
| Direction | Top to bottom | Which direction it opens with. |
| Depth | 0 |
Depth limit on open. 0 means no limit. |
| Fit the graph to the window on open | false |
Off opens at 100%, which keeps the node text crisp. On fits the whole graph instead. |
| Node label font size | 14 |
Point size of the project names, 6 to 32. Nodes are sized around their label, so this scales the whole graph. |
| Show the target framework on each node | false |
Adds each project’s target framework under its name in the graph. Off by default because it makes every node bigger — the framework is in the node’s tooltip and the status bar either way. |
| Excluded projects | empty | Semicolon-separated name patterns to leave out, e.g. *.Tests;*.Benchmarks. * and ? are supported, matching is case-insensitive, and the project you are looking at is never excluded. |
| Path to dot.exe | empty | Full path to Graphviz’s dot.exe. Leave empty to search the PATH. |
Grouping by solution folder
Group draws a box around the projects in each solution folder, with the folder’s name in a band across the top of the box. Nested folders nest their boxes. A project that is not in any solution folder is drawn on its own, outside every box.
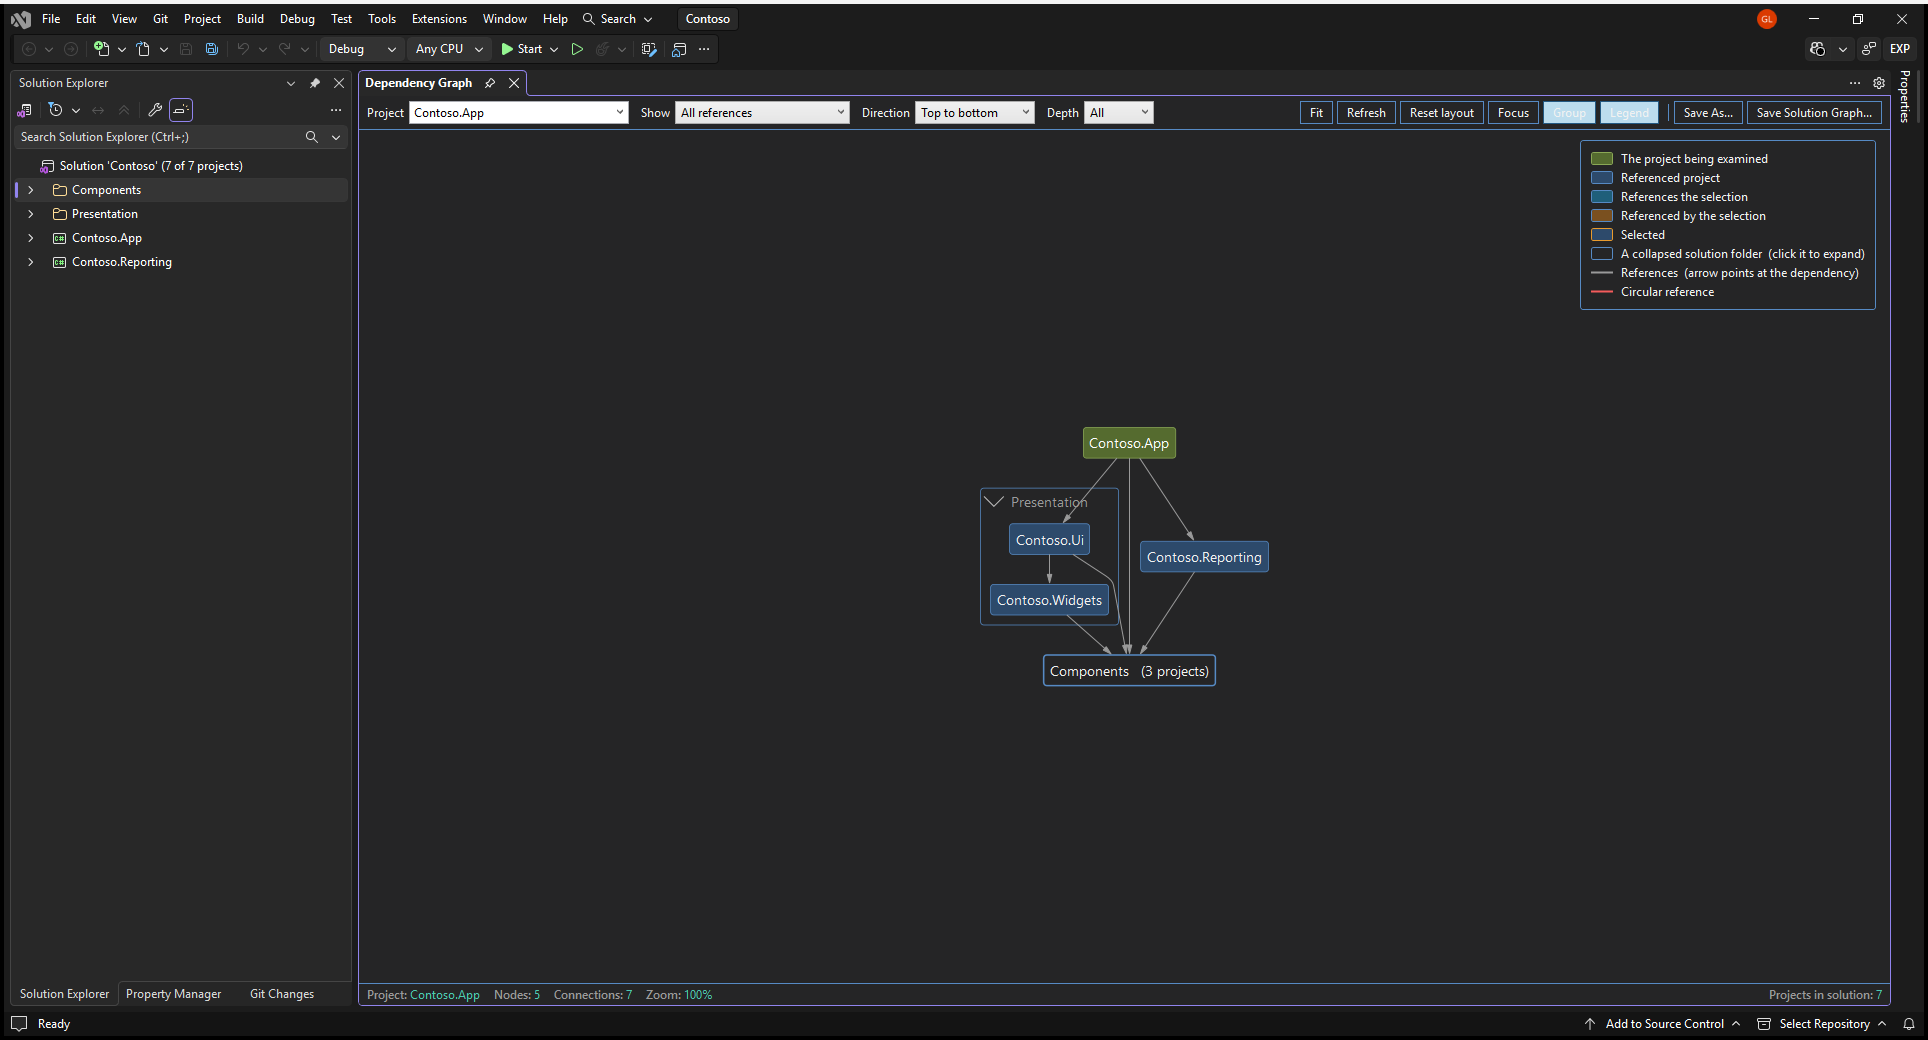
Clicking the chevron beside a folder’s name collapses it: the whole folder becomes one node labelled with its name and the number of projects in it, and every reference into or out of the folder is redrawn against that node. Click the collapsed node to expand it again. On a solution with a few hundred projects this is the fastest way to something readable.
And with Components collapsed to a single node:
Moving things about
Automatic layout is a starting point, not the last word. Drag a node, or a whole folder box, to where it reads better; its references follow it and nothing else moves.
What you dragged is remembered as an offset from wherever the layout puts that node, so it survives a rebuild - changing view, direction or depth, pressing Refresh, collapsing a folder. An offset rather than a fixed coordinate on purpose: every rebuild is a fresh layout, and a coordinate from the previous one would put the node somewhere arbitrary in the new one.
Reset layout on the command bar puts everything back, and so does Reset dragged positions on the background right-click.
Note that Refresh does not: it re-reads the solution, not the picture, and deliberately keeps what you have moved.
Offsets are written to %LOCALAPPDATA%\DependencyGraph\positions, one small file per solution,
so an arrangement survives closing the solution and closing Visual Studio. Nothing is written
into your repository. Because the file is keyed by the solution’s path, moving or renaming the
solution starts again from the layout.
Target frameworks
Each project’s target framework is in its tooltip and, for the selected project, in the status bar. Show the target framework on each node under Options puts it in the graph itself, under the project name.
A project that multi-targets shows one framework, not all of them. Automation reports a single
TargetFrameworkMoniker; the several targets live in the project file’s TargetFrameworks, which
it does not surface. So a project building both net472 and net8.0 says one of them rather than
inventing a list.
External references
A project that is referenced but is not itself in the solution is drawn with a dashed border and
labelled (external), because its own references were never scanned — the graph below it is
incomplete by definition.
When the solution changes
The window follows the IDE. Close the solution and it empties itself; open another and it rescans and roots on the new solution’s startup project. Adding or removing a project while the window is open updates it too. Refresh is there for the case the extension cannot see — editing a project’s references outside the IDE.
Themes
The graph follows the active Visual Studio theme, and re-colours itself if you switch theme while the window is open. Every text-on-background pairing meets WCAG AA in both the light and dark palettes.
Known limitations
- The combo boxes in the command bar keep Visual Studio’s default control chrome rather than the graph’s palette. Readable under either theme, but a light field on a dark bar.
- Two projects with the same name are shown in the picker with their paths appended, which is correct but wordy.
- DGML and DOT exports of the whole solution include references to projects outside the solution as extra nodes.
- Very large solutions are still large. Use Depth, Group with folders collapsed, and Deepest references only together.
- References redrawn after a drag are straight lines rather than routed splines, so a dragged node’s arrows can cross a box they would otherwise have gone around.
- Dragged positions are kept as an offset from wherever the layout puts a node. Moving or renaming the solution file loses them, since they are keyed by its path.
- Collapsing a folder aggregates its references onto one node, so the connection count drops: several references between the same pair of boxes become one arrow.
- Resizing the window rescales the graph with it, so the zoom drifts from the 100% it opens at. That is MSAGL scaling its own canvas; Fit, or the mouse wheel, puts it back where you want.
- The command bar scrolls sideways rather than wrapping when the window is too narrow for it.